Regional Price Gaps: Why Costs Vary Between States
Kuala Lumpur costs more than Kelantan — here’s why. Discover which states have the highest living costs and what drives those differences.

Why Your Wallet Feels Different Across Malaysia
It’s not your imagination. A bowl of nasi lemak costs different amounts depending on where you buy it. A liter of petrol at the pump isn’t the same everywhere. Rent in Subang Jaya and rent in Kuching aren’t even close.
These price differences aren’t random. They’re driven by specific factors — transportation costs, local supply chains, population density, and how much businesses pay to operate in each area. Understanding these gaps helps you see why inflation hits some states harder than others.

The Four Main Cost Drivers
These factors explain why prices aren’t the same everywhere
Transportation & Logistics
Getting goods from Kuala Lumpur to Sabah costs more than delivering to Selangor. Distance, fuel, and road conditions all add up. Remote states pay the logistics premium.
Real Estate & Operating Costs
Shop rental in Bangsar is RM8,000/month. In Ipoh, it’s RM2,500. Higher rent means businesses need higher margins to stay profitable. That cost passes to you.
Population Density & Demand
Kuala Lumpur has 1.9 million people. Perlis has 285,000. Higher demand means better supply chain efficiency and more competition keeping prices lower in KL.
Fuel Subsidy Effects
Fuel subsidy changes hit rural states harder. When petrol prices rise, transport costs spike immediately. Rural economies depend more heavily on transport than urban areas.
Which States Cost the Most?
The gap is real. A typical shopping basket in Kuala Lumpur runs about 18-22% higher than the same items in Kelantan or Terengganu. You’re not just paying for the products — you’re paying for the delivery, the rent, and the overhead.
Selangor ranks second-highest after KL because it’s still part of the Klang Valley metropolitan area. Food prices here are driven up by the same supply chain dynamics and operating costs. But move 100km north to Perak? Prices drop noticeably.
Most Expensive States: Kuala Lumpur (100% baseline), Selangor (95%), Penang (92%)
Least Expensive States: Kelantan (78%), Terengganu (80%), Perlis (79%)
Don’t mistake “least expensive” for “cheap.” These states still face rising costs. Food inflation affects them the same way it affects KL. But the baseline is lower, so percentage increases feel less dramatic in absolute terms.


What This Means for Your Budget
A household spending RM2,000/month on food and essentials in Kelantan would spend roughly RM2,400 in Kuala Lumpur for the same items. That’s RM400 more every month. Over a year, it’s RM4,800 — money that could go toward savings or emergencies.
This matters when you’re comparing living costs across states. If you’re thinking about moving for a job, don’t just look at salary. Factor in that your money won’t stretch as far in more expensive states. A RM5,000 salary in Kuala Lumpur feels less substantial than RM5,000 in Perlis.
Plus, when fuel subsidies change or transportation costs rise, rural states often feel it first and hardest. The supply chain is longer, so price shocks take longer to settle. Urban areas benefit from more competition and faster adjustment.
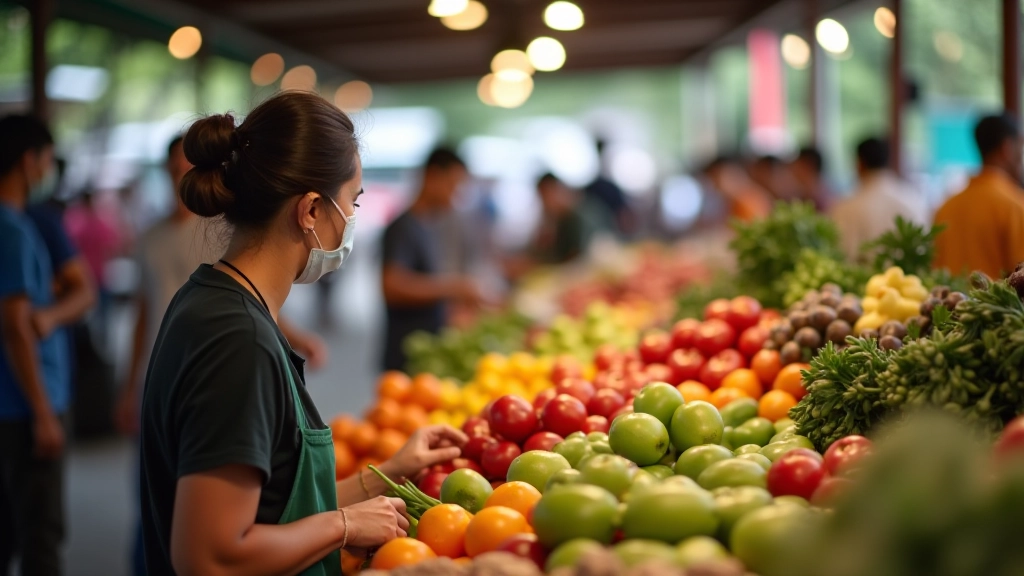
Food Prices: The Clearest Example
Food is the best indicator of regional price differences because it’s tracked consistently across all states in the Consumer Price Index. Here’s what you’ll typically see:
The variations depend on what’s locally produced. Vegetables grown in Perlis or Kedah cost less there because transportation is minimal. Rice travels further to reach Sabah, so prices are higher. It’s basic supply and demand physics.
The Takeaway
Regional price gaps aren’t going away. They’re structural — built into how Malaysia’s supply chains work and how economies function at different scales. What you can do is understand them. When you’re tracking your own inflation, comparing living costs, or making financial plans, remember that price changes don’t happen uniformly across all states.
If you’re seeing your groceries cost more, check whether you’re in a high-cost state. If you’re moving for work, factor regional costs into your decision. And if you’re monitoring the Consumer Price Index, remember that the national average masks real variations that affect different communities differently.


Disclaimer
This article is for educational purposes only and presents general information about regional price differences in Malaysia. Price variations cited are based on typical market observations and Consumer Price Index patterns. Actual prices vary by location, specific retailer, product brand, and market conditions. The figures mentioned are illustrative examples and shouldn’t be treated as exact pricing guarantees. For precise current pricing in your area, check with local retailers or the Department of Statistics Malaysia. This content is not financial advice and doesn’t constitute recommendations for personal financial decisions.