How Malaysia’s Food Price Index Actually Works
Learn which items are tracked, how weight is calculated, and why some price changes show up before others do in official reports.
Read Full ReportComprehensive data on food prices, transport costs, and fuel subsidy effects across Malaysian states

Detailed monitoring of Malaysia’s economic indicators that affect your daily costs
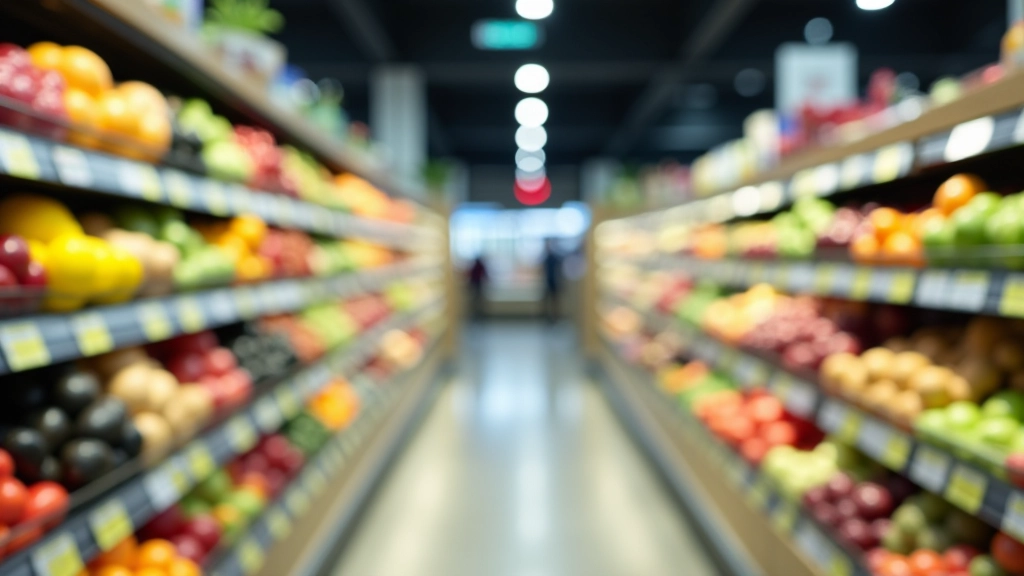
We monitor how prices change for essential food items across Malaysian markets. Our basket includes staples like rice, vegetables, eggs, and meat — tracking real changes that hit household budgets first.
From petrol prices to public transport fares, we analyze how mobility expenses vary between Kuala Lumpur and rural areas. These costs make up a significant part of living expenses for most families.
Government subsidy changes create ripple effects through the economy. We explain how fuel rationalization impacts pump prices and the broader cost of living in different regions.
Living costs aren’t the same everywhere. We break down price differences between states, showing how location affects what families actually spend on essentials each month.
In-depth analysis of Malaysia’s current economic situation
Learn which items are tracked, how weight is calculated, and why some price changes show up before others do in official reports.
Read Full Report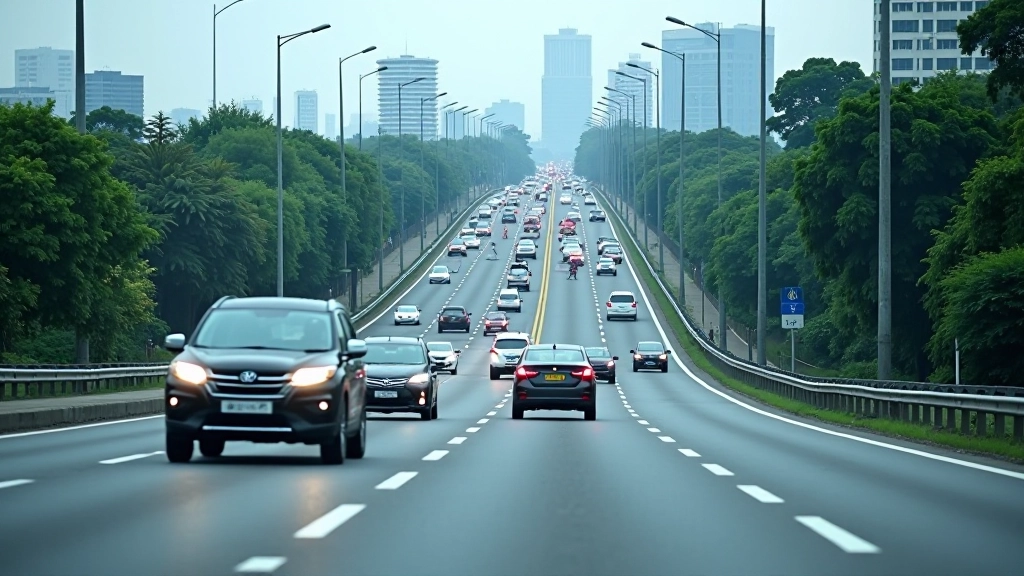
Breaking down fuel prices, public transport fares, and vehicle maintenance costs across Malaysia’s biggest cities and rural areas.
Read Full Report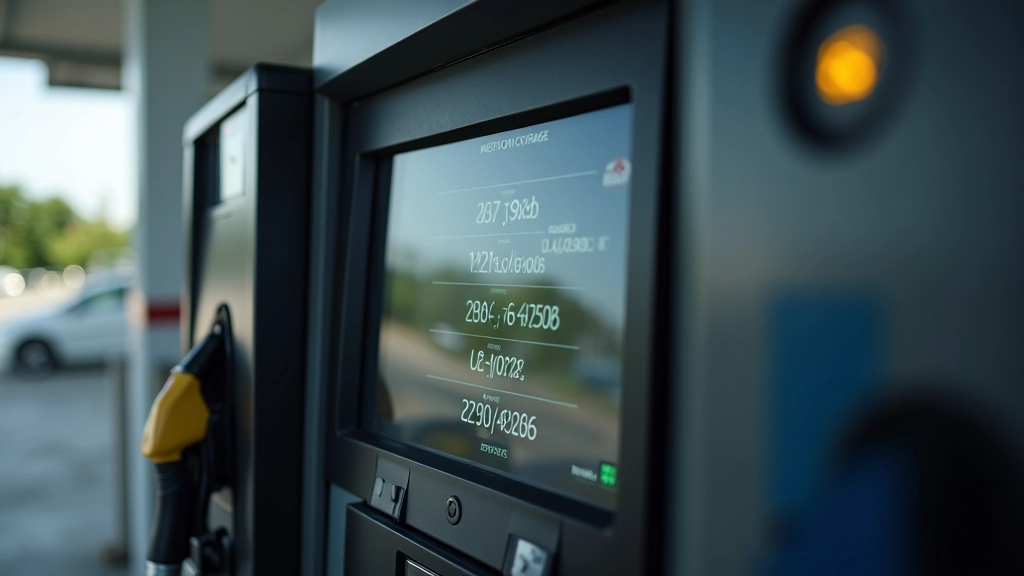
How government fuel subsidy decisions affect pump prices and create ripple effects through the entire cost of living — real numbers explained.
Read Full ReportUnderstanding the process behind Malaysia’s economic data collection
We gather price information from markets, petrol stations, and transport hubs across all 13 Malaysian states. This happens regularly throughout each month to catch price movements as they occur.
Our monitoring basket includes carefully selected items that represent what typical Malaysian families actually buy. Food, transport, utilities, and other essentials are weighted based on spending patterns.
We analyze the collected data to identify trends, regional differences, and subsidy impacts. Reports break down which categories are driving price changes and how different states are affected differently.
Real feedback from economists, policymakers, and families tracking costs
“Wasn’t sure where to find reliable CPI breakdown by state until I found this. The transport and fuel subsidy sections really help me understand why prices vary so much between Kuala Lumpur and Kelantan.”
“We use this data for policy research. It’s the clearest breakdown I’ve found of how food price changes actually affect household budgets across different income levels.”
“The fuel subsidy section helped me understand why my groceries got more expensive even though petrol prices stayed the same. Now I actually see the connections between different costs.”
Clear answers about CPI, cost of living, and what our data means
The CPI basket is a selection of goods and services that represent typical household spending. It includes food items (rice, vegetables, meat), transport (petrol, bus fares), utilities, and other essentials. The specific items and their weights reflect what Malaysian families actually buy and how much they spend on each category.
Regional cost disparities exist due to several factors: transport costs from distribution centers, local market conditions, wage differences, and availability of goods. Petrol is cheaper in some areas, while fresh produce might be pricier in locations far from farming regions. Fuel subsidy changes affect states differently depending on their distance from refineries.
We track and report on price movements regularly throughout the month. Different reports have different frequencies — some monthly, some quarterly. This allows us to catch important price changes quickly rather than waiting for annual data. Regional reports help you see how your specific state’s costs are changing.
When fuel subsidies change, petrol prices move immediately. But the effects ripple outward: transport companies pay more for fuel, so delivery costs increase. This pushes up food prices in stores, restaurant meals, and service costs. Understanding subsidy rationalization helps explain why seemingly unrelated prices change at the same time.
Explore additional resources and guides about Malaysia’s economy
Comprehensive guides explaining economic concepts, how inflation affects your budget, and detailed breakdowns of subsidy policies.
Browse GuidesLearn how we collect data, what methodology we use, and why our approach provides the clearest picture of Malaysia’s cost of living landscape.
Learn MoreHave questions about CPI data, need custom analysis, or want to discuss specific cost trends? We’re here to help you understand Malaysia’s economic picture.
Contact UsWhether you’re tracking food price trends, analyzing fuel subsidy impacts, or comparing costs between states, we’re ready to help you understand Malaysia’s economic data.
Get in Touch