Transport Costs Rising: What the Data Shows
Breaking down fuel prices, public transport fares, and vehicle maintenance costs across Malaysia’s biggest cities and rural areas.
Understanding Transport in Malaysia’s CPI Basket
Transportation accounts for roughly 17% of Malaysia’s Consumer Price Index — that’s the second-largest category after food and beverages. When we track what Malaysians actually spend money on, transport keeps showing up as a major expense.
It’s not just about petrol prices either. We’re looking at public transport fares, motorcycle maintenance, vehicle registration, insurance, and the cost of getting around cities like Kuala Lumpur, George Town, and Johor Bahru. The data tells a story that’s gotten more complex over the last few years.
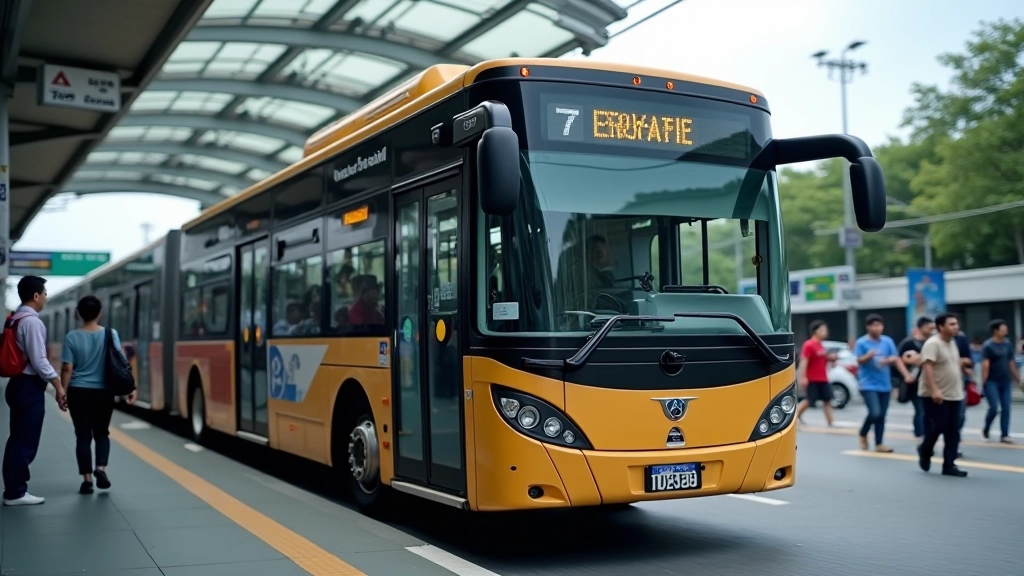
Transport costs have risen at different rates across Malaysia’s regions, with urban areas experiencing sharper increases than rural zones.

How Transport Breaks Down in the CPI
The transport sub-index doesn’t just measure petrol. We’re tracking five main categories, and they don’t all move at the same speed. Vehicle purchases, fuel and lubricants, maintenance and repairs, public transport, and vehicle insurance each have their own price trajectories.
Fuel and lubricants make up about 40% of the transport index. That’s why every announcement about fuel subsidy changes creates headlines — it directly hits the wallet. But here’s what surprises people: maintenance costs have been climbing faster than fuel prices in some regions. Parts, labour, and services have gotten noticeably more expensive.
- Vehicle Purchases: Weighted at approximately 25%
- Fuel & Lubricants: Weighted at approximately 40%
- Maintenance & Repairs: Weighted at approximately 15%
- Public Transport: Weighted at approximately 12%
- Vehicle Insurance: Weighted at approximately 8%

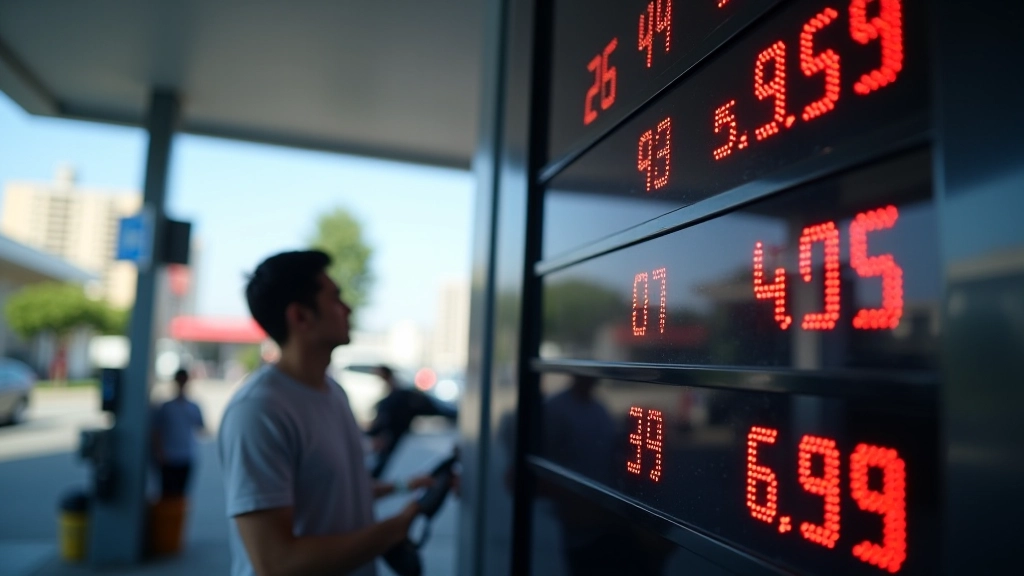
The Fuel Subsidy Rationalisation Effect
Between 2022 and 2026, Malaysia’s government restructured fuel subsidies multiple times. The impact shows up clearly in the CPI data. When subsidies tighten, pump prices rise. When they’re loosened, prices drop. But the ripple effects extend far beyond the petrol station.
A 15-sen increase at the pump doesn’t just affect drivers — it changes what delivery companies charge, how much taxi fares climb, and eventually, what you pay for groceries. The transport index captures this domino effect. We’ve seen periods where fuel prices alone drove the entire transport sub-index upward by 2-3%.
What’s interesting is that subsidies aren’t uniform across vehicle types. Motorcycles get different treatment than cars, which affects the calculation differently depending on who you are. A motorbike commuter feels the squeeze differently than someone driving a car to work.
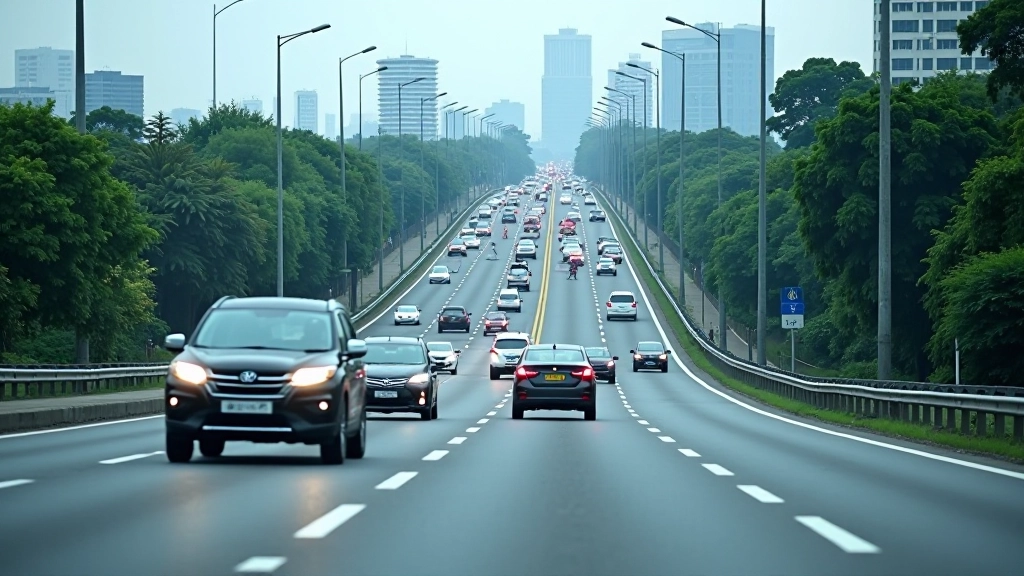
Why Your City Pays Different Prices
Transport costs aren’t uniform across Malaysia. Urban and rural areas experience completely different price pressures, and state-by-state comparisons reveal surprising patterns.
Urban Centers
Kuala Lumpur, George Town, and Johor Bahru show the highest transport costs. Congestion, parking fees, and premium fuel grades push prices up. Public transport usage is higher here, but fares have climbed steadily — LRT and MRT increases affect the index directly.
Secondary Cities
Mid-sized cities like Kuala Terengganu and Ipoh fall in the middle range. Less congestion than major cities, but less public transport infrastructure too. Most people rely on personal vehicles, which means fuel and maintenance costs matter more here.
Rural Areas
Rural zones often have lower fuel prices due to less demand and smaller margins, but personal vehicle dependence is almost total. Limited public transport means everyone drives. The cost equation flips — fuel’s cheaper, but there’s no alternative.

The Hidden Pressure: Maintenance and Repair Costs
Everyone focuses on fuel prices, but that’s only part of the story. Maintenance costs have become a significant component, and they’re growing faster than petrol in some states. Parts are more expensive — imported components face tariffs and logistics costs. Labour rates have climbed as mechanics’ skills command higher wages.
Between 2023 and 2026, maintenance and repair costs jumped roughly 8-12% depending on your state. That’s faster than inflation in most other categories. You’re not just paying more for oil changes and brake pads — you’re paying for the entire ecosystem of vehicle upkeep.
Insurance costs complicate this further. Vehicle insurance premiums reflect accident trends, repair costs, and claims history. As repair expenses climb, insurers adjust premiums upward. It’s a feedback loop that keeps building.

Public Transport Fares and Accessibility
Public transport doesn’t affect everyone equally in Malaysia’s CPI calculation. In Kuala Lumpur, where LRT and MRT usage is widespread, fare increases ripple through thousands of daily commuters. In rural states, public transport barely factors into household spending because it’s simply not available.
LRT and MRT fare structures changed significantly from 2024-2026. Distance-based pricing replaced some flat rates, which means longer commutes cost more. This particularly affects people in suburban areas who commute into the city for work. The CPI captures these increases and weights them according to actual usage patterns in each region.
Bus fares tell a different story. They’ve risen more gradually, but more consistently. Regular passengers — typically lower-income workers — feel this pressure every single day. Even small fare increases compound quickly when you’re taking two buses daily, five days a week.
What the Numbers Actually Tell Us
Year-on-Year Transport Index Changes
The transport sub-index increased by approximately 4.2% from March 2025 to March 2026. That’s notably higher than overall CPI inflation, which sits around 2.8%. Transportation is outpacing general inflation — your transport costs are climbing faster than the average price increase.
State-Level Variation (March 2026)
- Kuala Lumpur: +5.1% year-on-year (highest)
- Selangor: +4.8% year-on-year
- Penang: +4.5% year-on-year
- Johor: +4.1% year-on-year
- Kelantan: +2.9% year-on-year (lowest)
Cost Drivers by Category
- Fuel Prices: +3.2% (most volatile)
- Maintenance: +6.7% (fastest growing)
- Public Transport: +3.8%
- Vehicle Insurance: +5.4%
- Vehicle Purchase: +2.1% (most stable)
About This Data
This article presents publicly available data from Malaysia’s Department of Statistics on the Consumer Price Index and transport sub-indices. The figures, percentages, and state-level comparisons reflect official CPI basket calculations and weightings as of March 2026.
CPI data is revised periodically and historical comparisons can vary based on the base year used. Regional variations exist due to different consumption patterns, geographic factors, and local market conditions. Your personal transport costs may differ from the aggregate figures shown here depending on your specific circumstances, location, and spending patterns.
This content is informational and educational in nature. It’s designed to help you understand how transport costs are measured and tracked in Malaysia’s cost-of-living statistics. For detailed analysis specific to your situation, consult with financial advisors or economists specializing in Malaysian economic data.