CPI Basket Composition Analysis
We break down Malaysia’s official CPI basket structure—showing you exactly how food, transport, housing, and utilities are weighted. You’ll understand which categories drive price movements and how regional variations affect the national index. Our analysis includes historical changes since 2010 and methodology explanations that cut through the jargon.
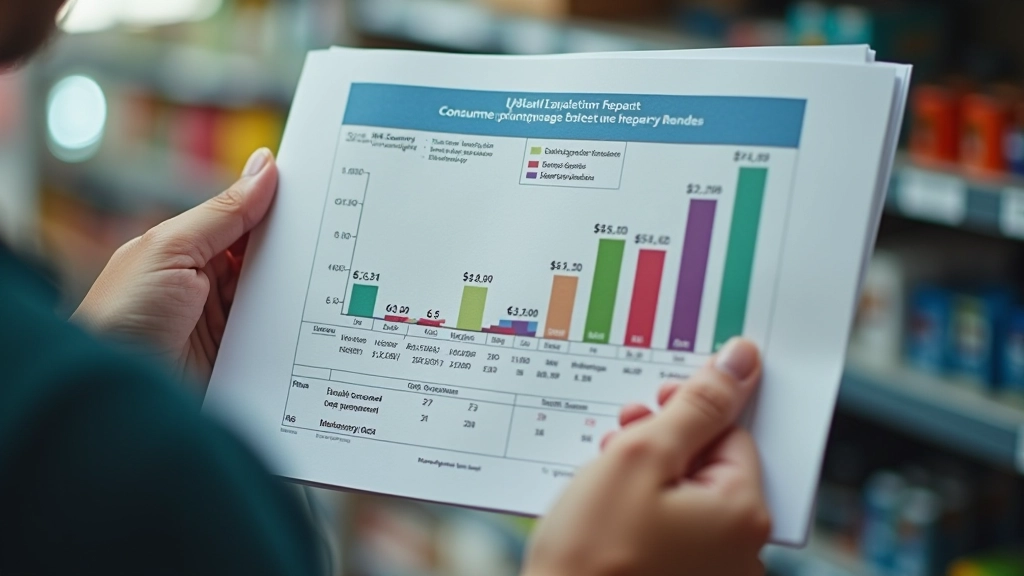
Food & Transport Sub-Index Monitoring
Weekly and monthly tracking of food price movements and transport costs—the two categories that hit household budgets hardest. We identify seasonal patterns, commodity-specific trends, and forecast short-term price direction. Perfect for retail businesses, logistics companies, and government agencies planning subsidy adjustments.
Fuel Subsidy Impact Assessment
Quantify how fuel subsidy changes ripple through the economy. We measure direct price effects on transport costs and indirect impacts on food prices (from distribution changes) and inflation across regions. Our reports help policymakers evaluate affordability trade-offs and communicate subsidy decisions to the public with evidence.
Regional Cost of Living Disparities
Compare living costs across Malaysia’s 13 states. Our state-level CPI analysis reveals that Kuala Lumpur’s inflation doesn’t match Perlis or Sabah. We map regional variations in food, housing, and transport costs so you can make location-specific business decisions, set fair wages, or design targeted assistance programs.